Reforestation in the world
Personal project, TidyTuesday

Do you have data? We provide data visualisation consultancy and design of charts and infographics.
We help you with your pitch deck and reports.
We deliver workshop on data visualisation, accessibily
data cleaning, statistics with R and Python.
We provide a mixture of traditional and digital illustration technique. We create the right illustration for your needs. Journal cover, graphical abstract and figure for articles and grant proposal.
Rita was a joy to work with. Mindful of deadlines and ways of working, Rita addressed her brief with great expertise and understanding. The content she produced was of excellent standard and was very well received during user testing. I'd love the chance to work with her again!
Amelia H, Content development editor, Pearson
Rita has presented lectures and tutorial sessions on the use of R in Crystallography over many years at a number of workshops organised by the IUCr Commission on Crystallographic Computing and by the European Crystallographic Association, Special Interest Group in Crystallographic Computing. Her in-depth understanding of the underlying statistics and use of R, clear presentation and rapport with students has made her one of the most valuable contributors to these events.
Harry Powell, Imperial College of London
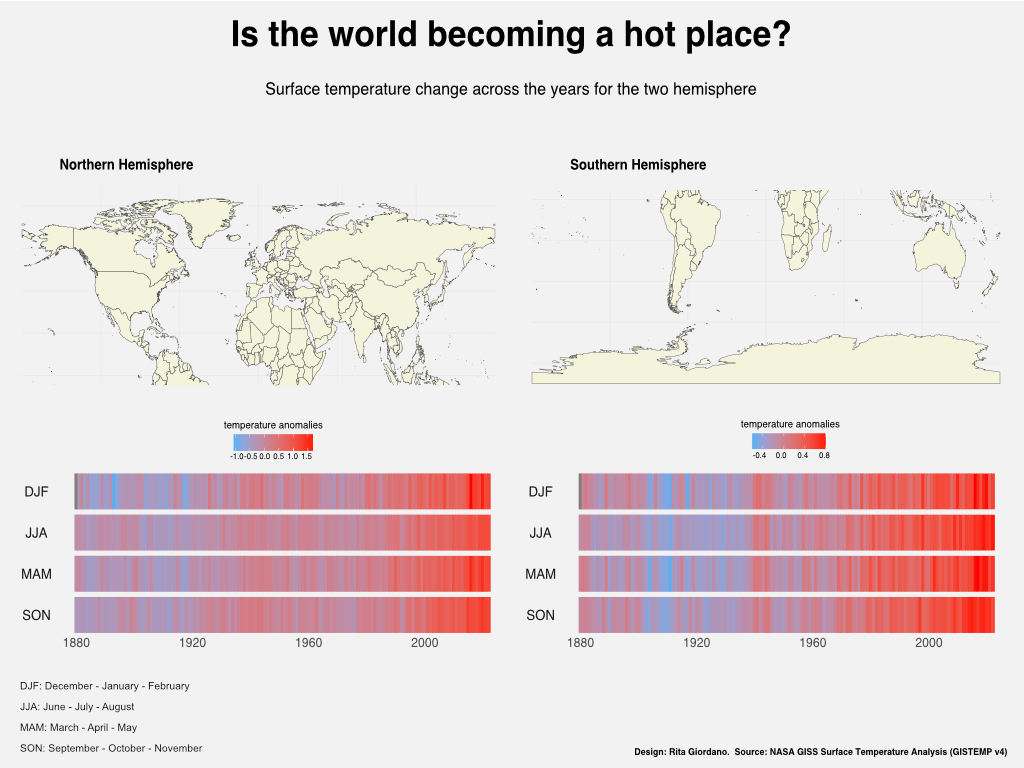
Personal project, TidyTuesday

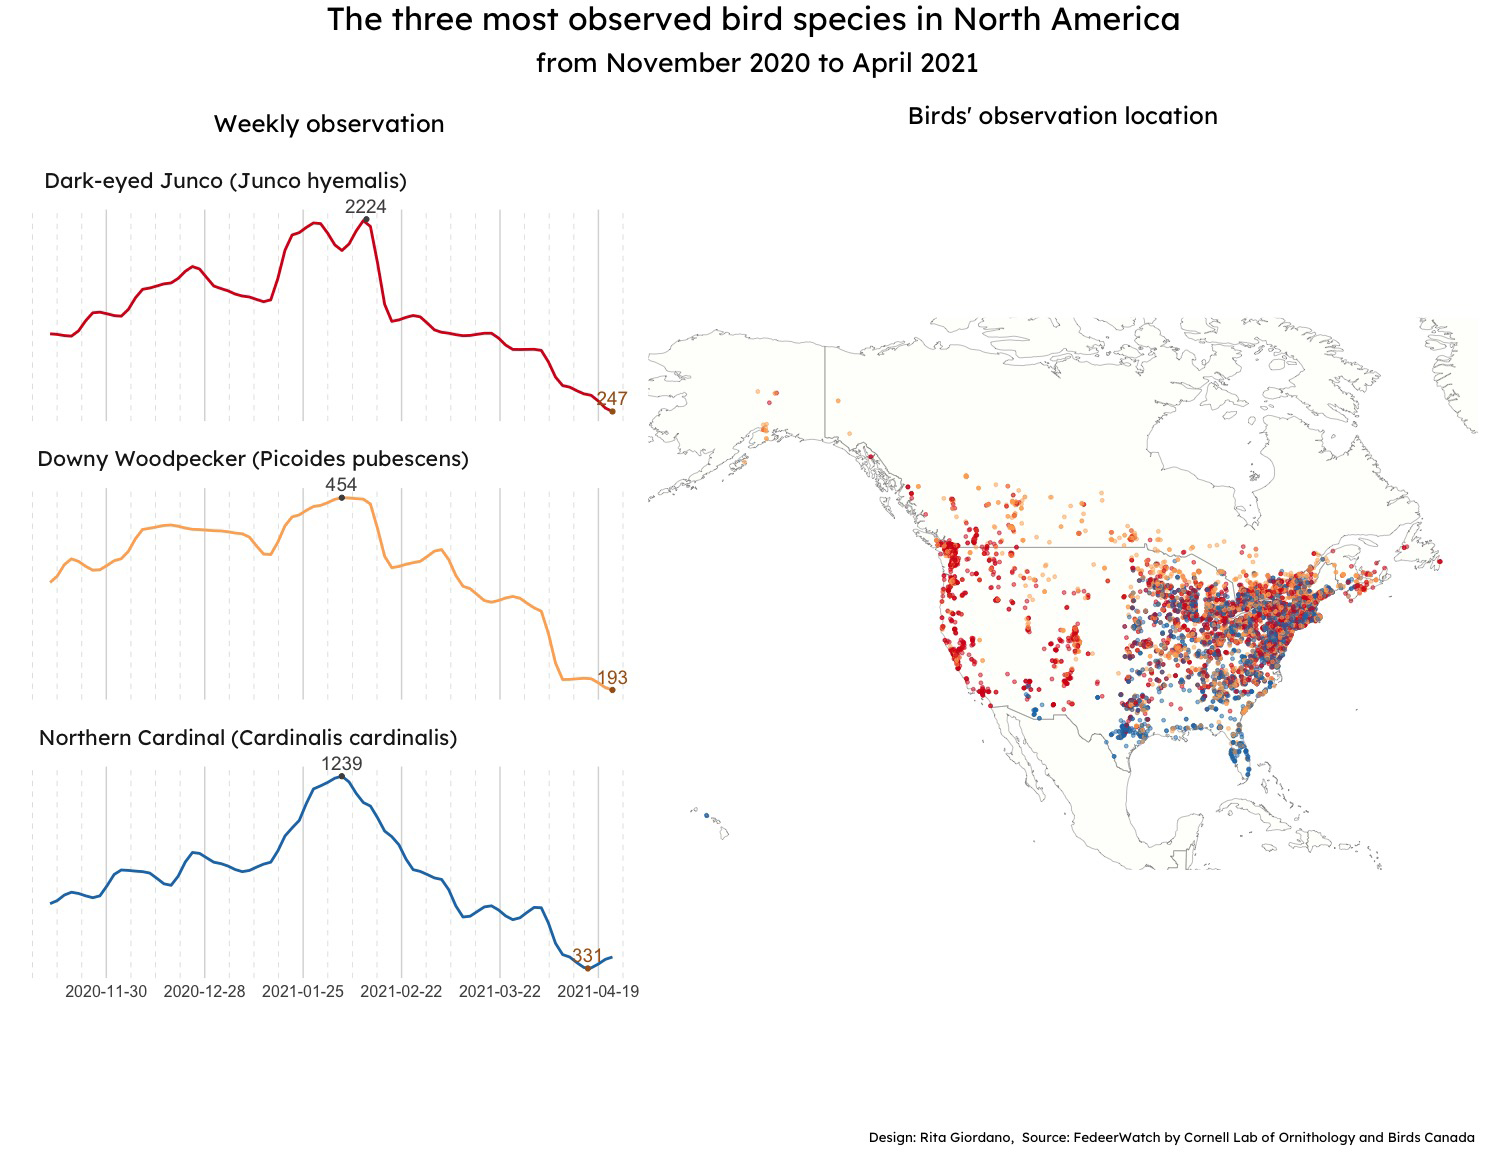
Personal project, TidyTuesday
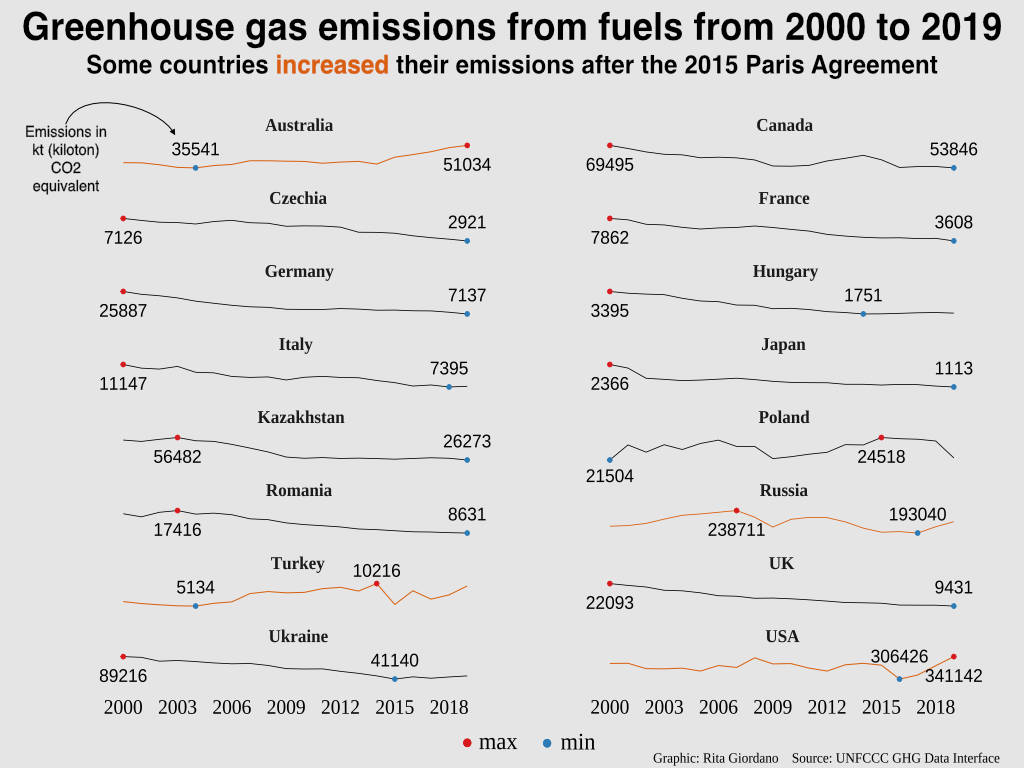
Personal project, TidyTuesday
Personal project, TidyTuesday

Personal project
Personal project
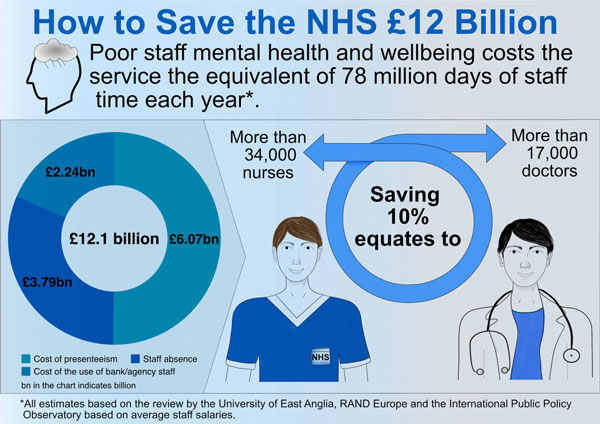
Client: The Internationa Public Policy Observatory (IPPO)
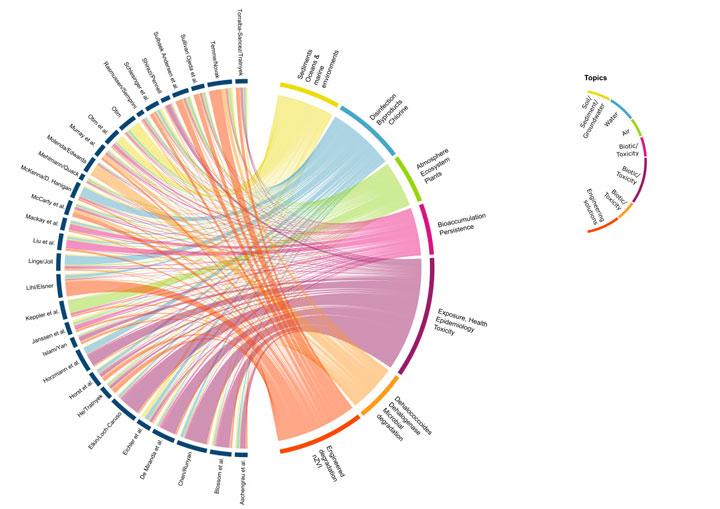
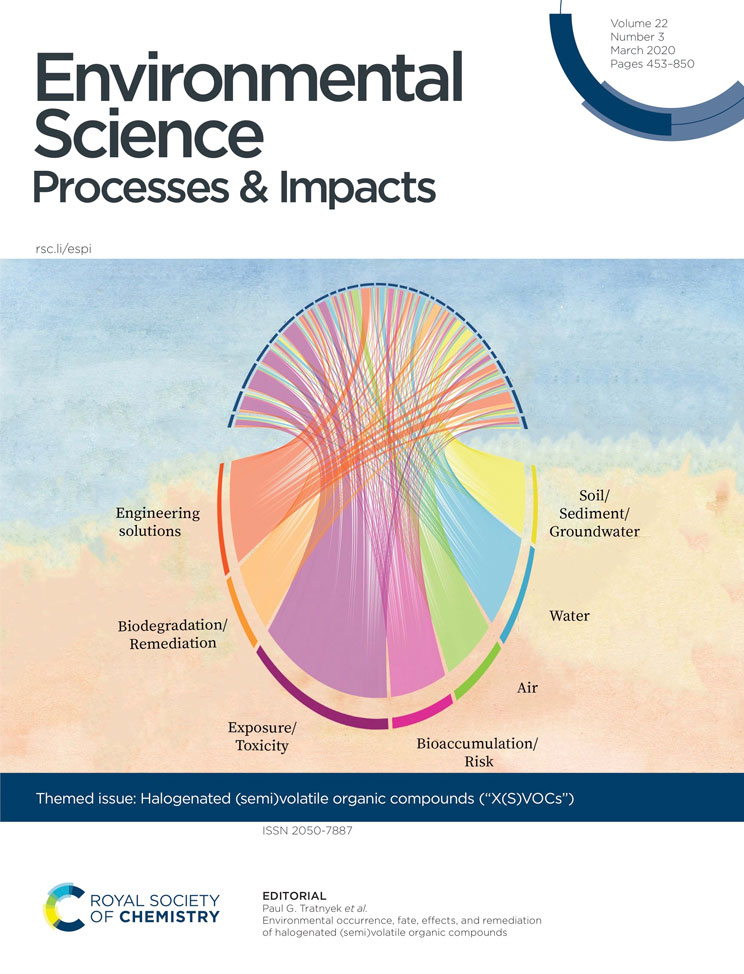
Client: Royal Society of Chemistry, editorial article
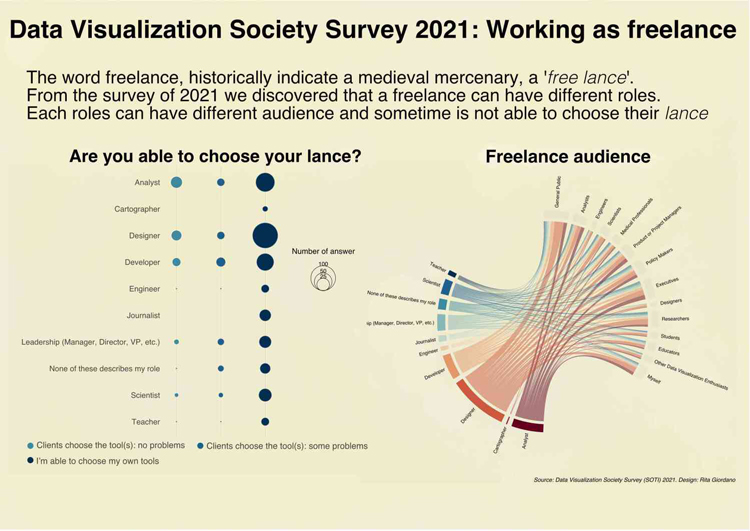
Visualisation per the Data Visualization Society survey, featured in the top 30th.
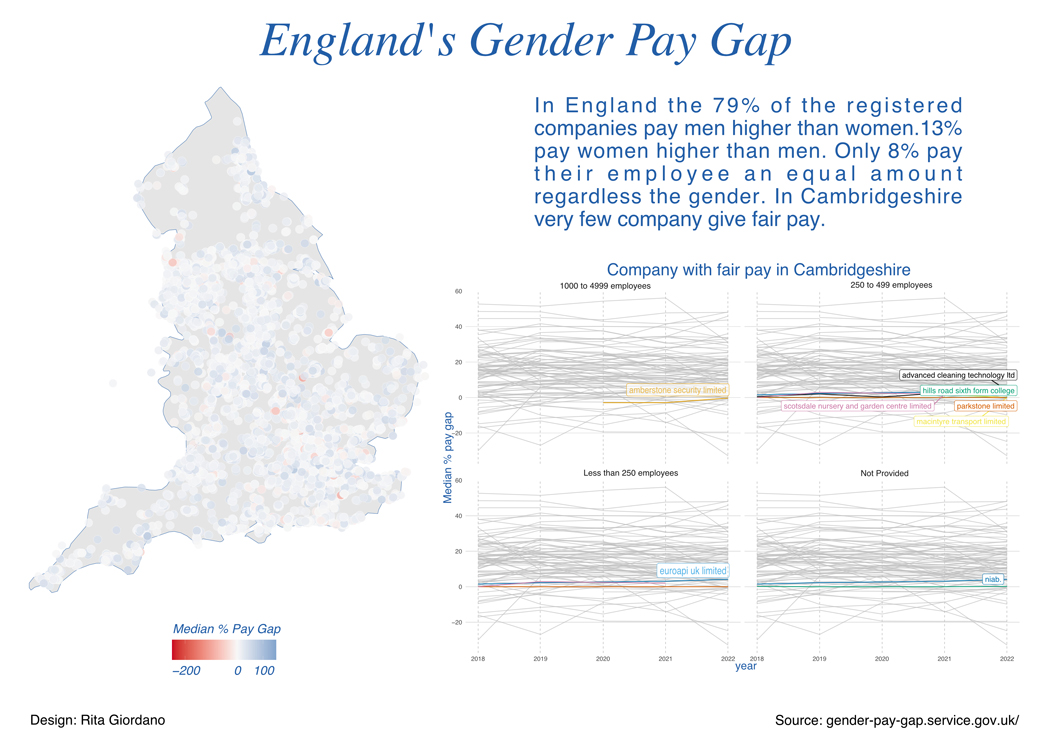
Personal project.

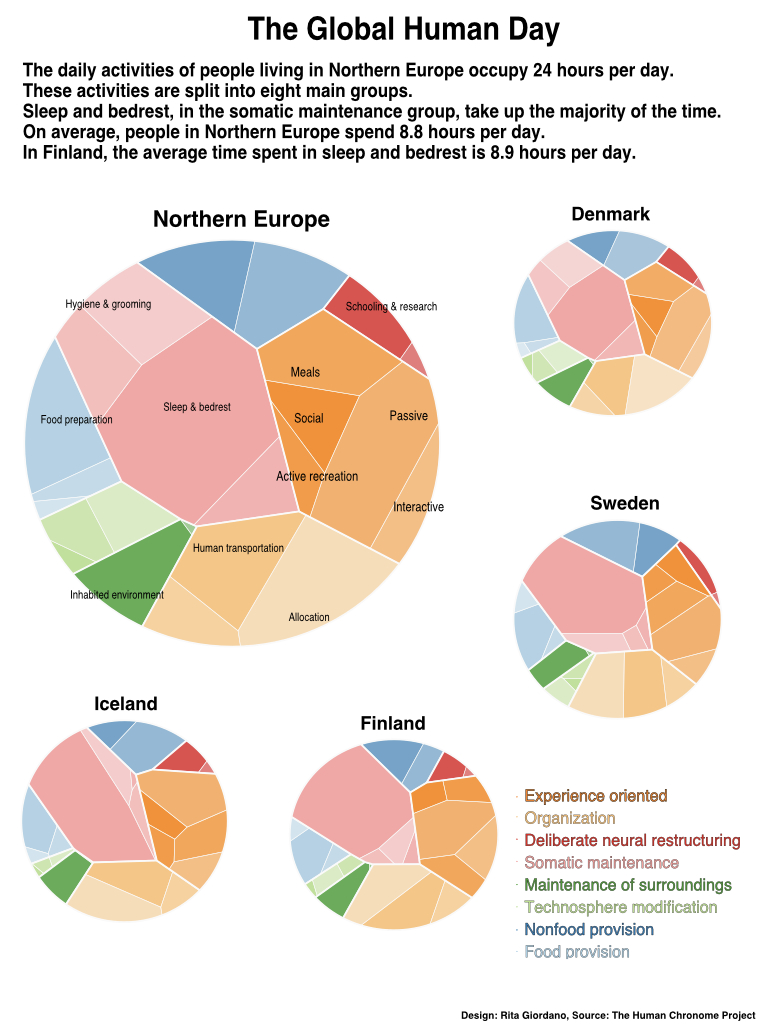
Personal project
Personal project, TidyTuesday
University of Cambridge
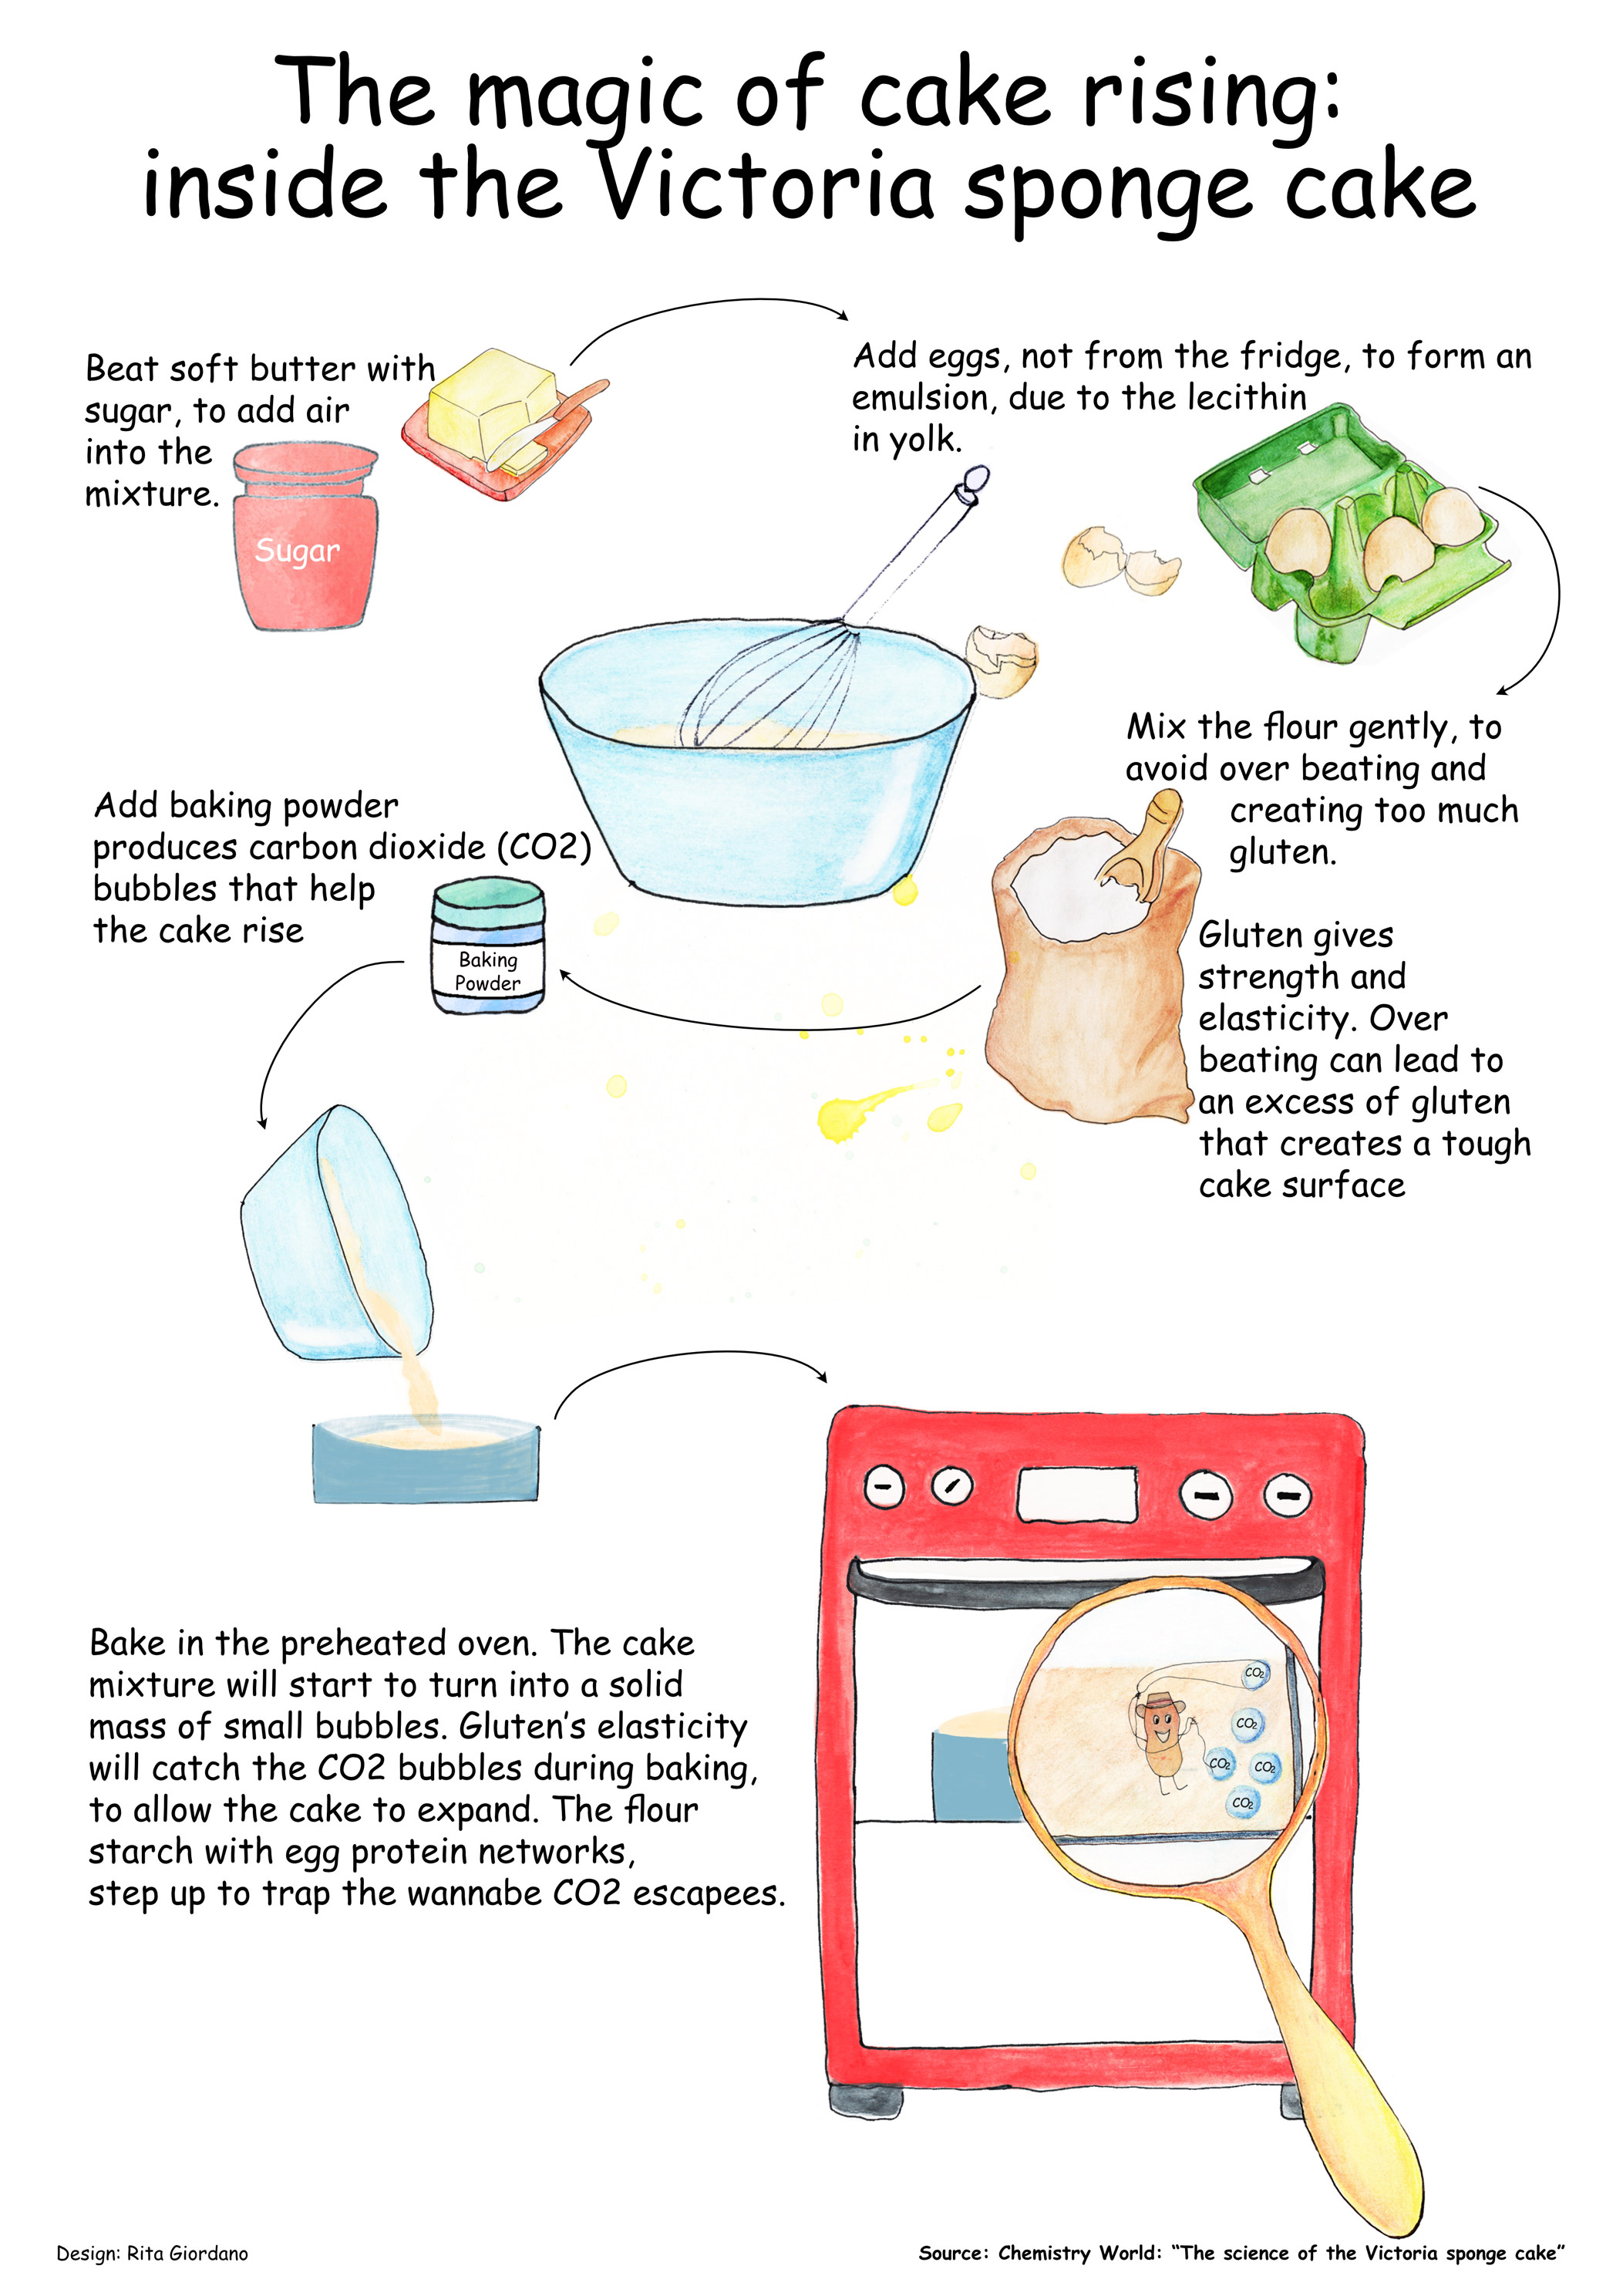
Personal project: children science illustration
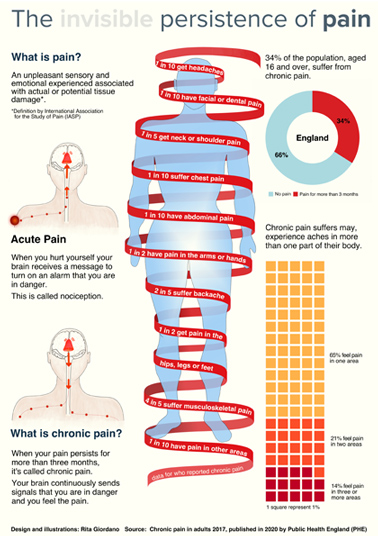
Personal project on chronic pain.
Client: Royal Society of Chemistry.

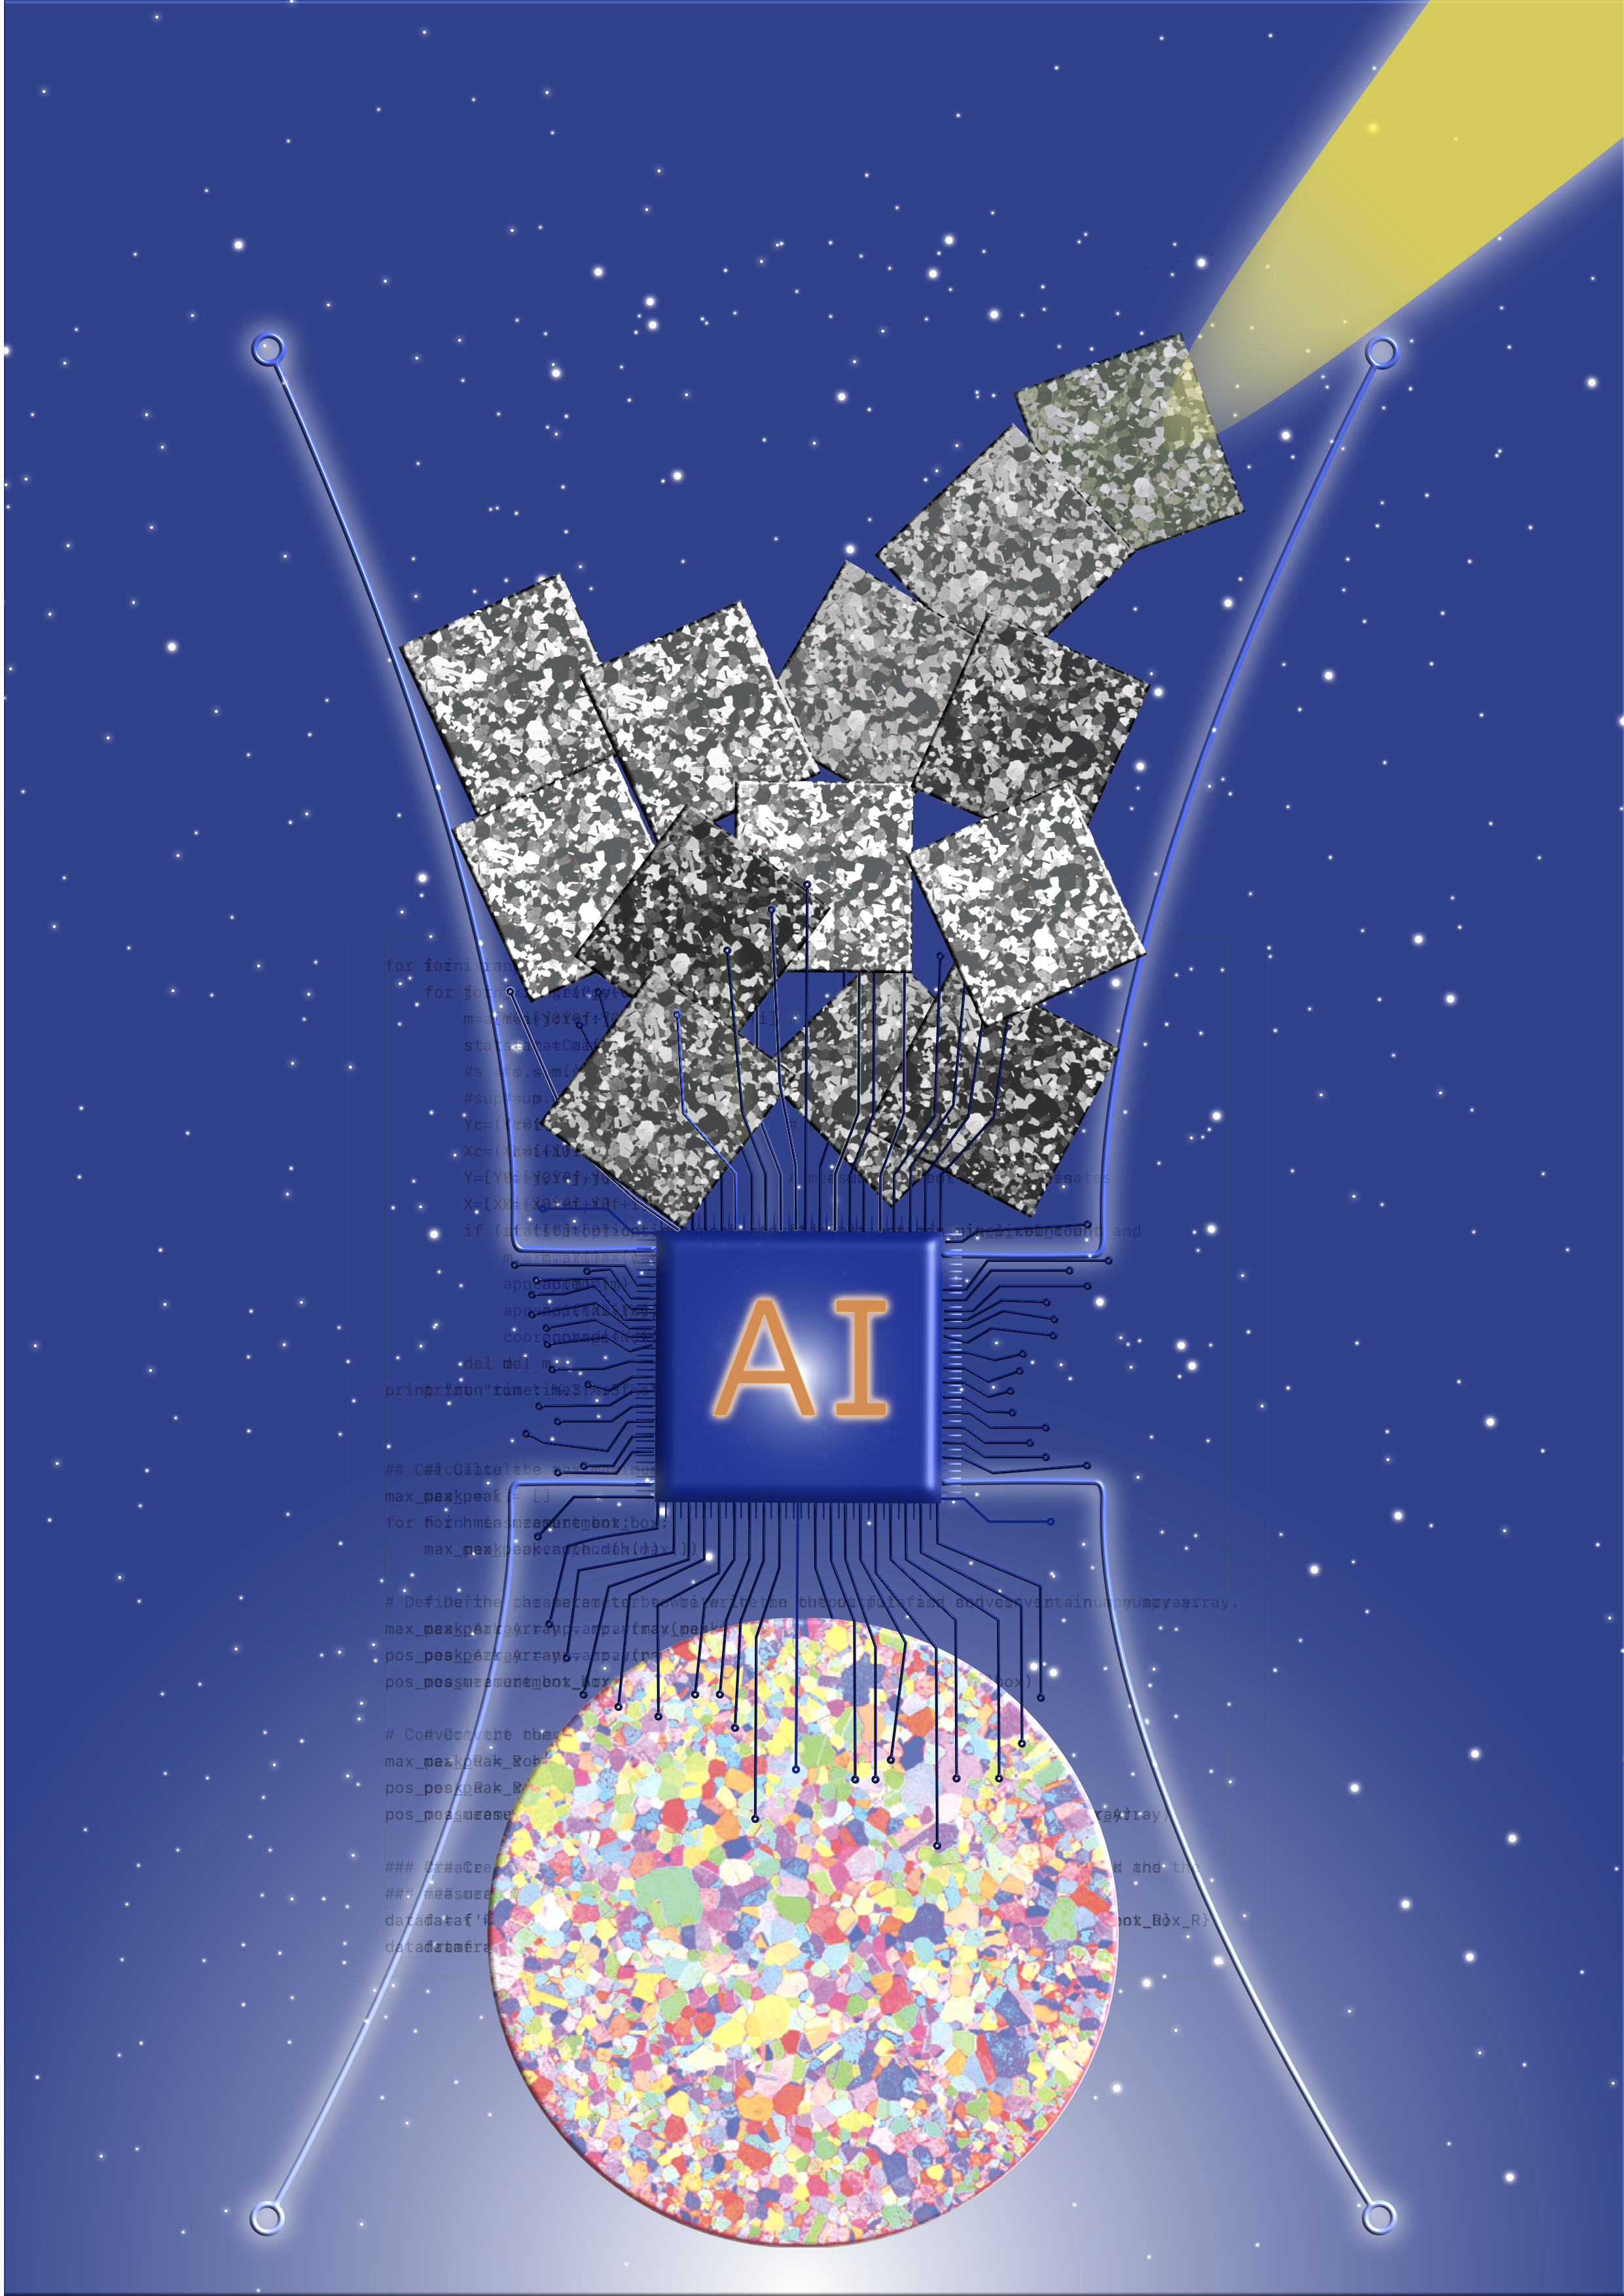
Personal project: illustration of sars-cov-2 using blender
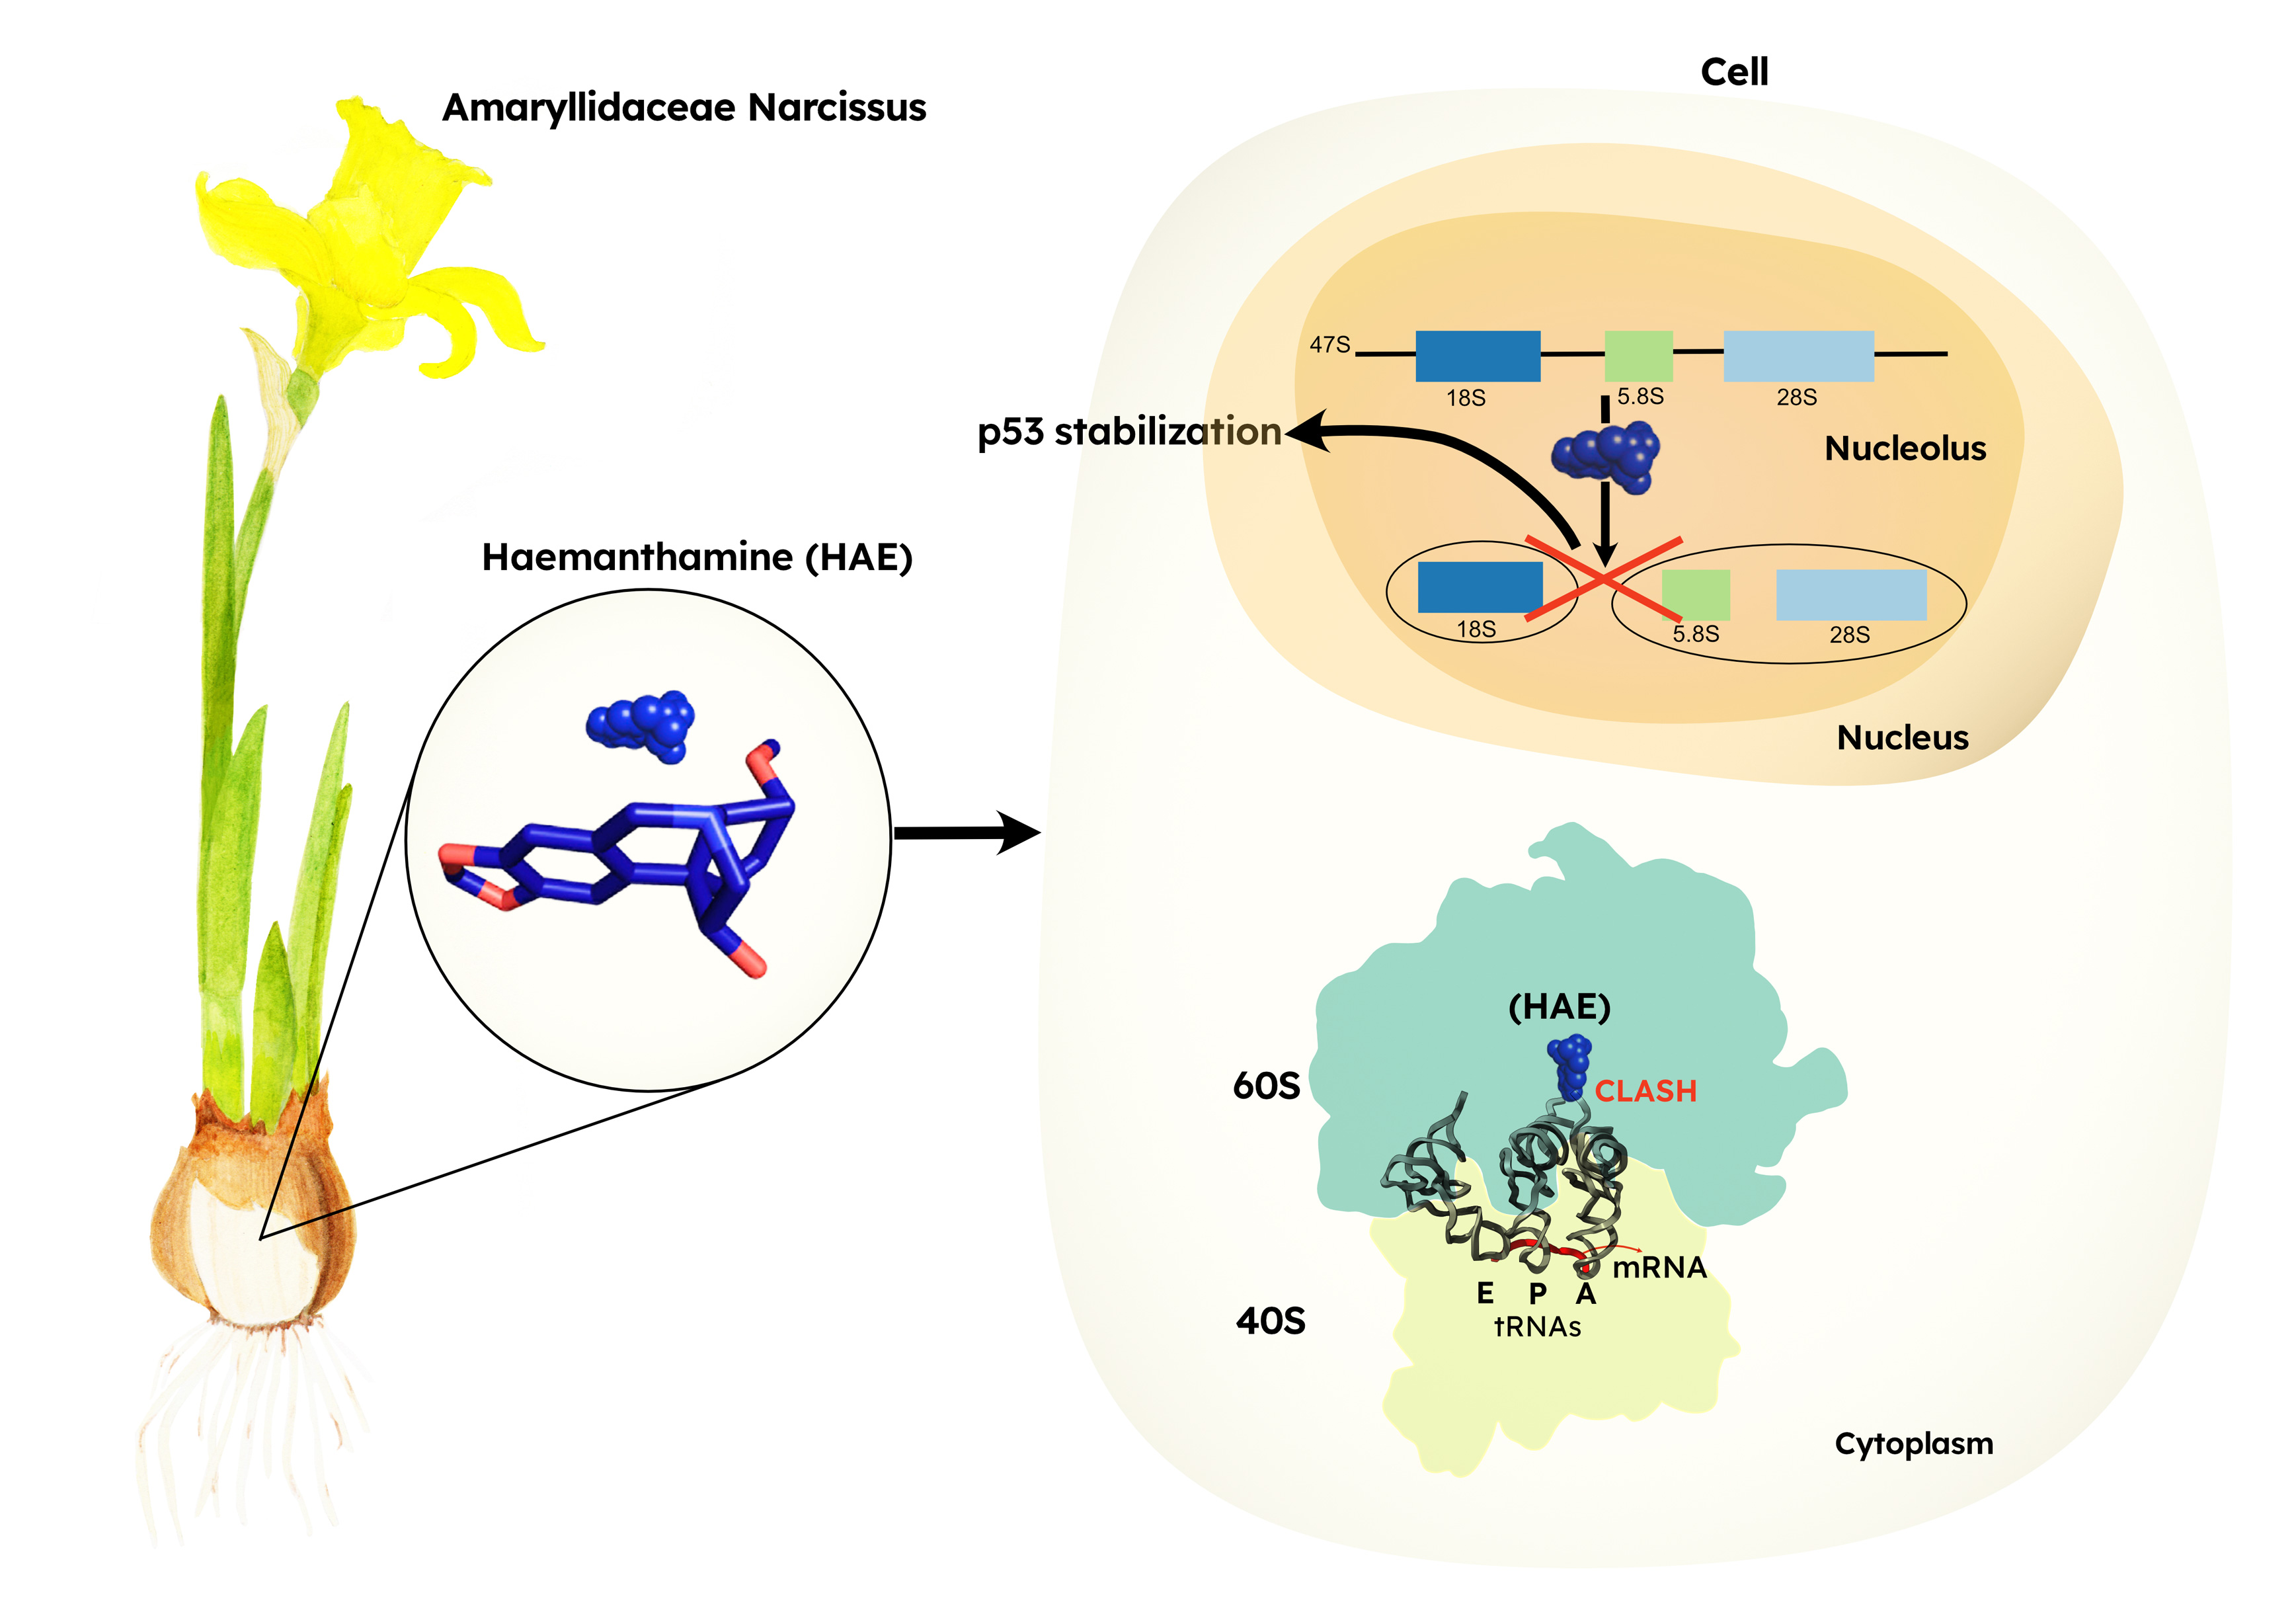
Client: Research scientist Cambridge's University
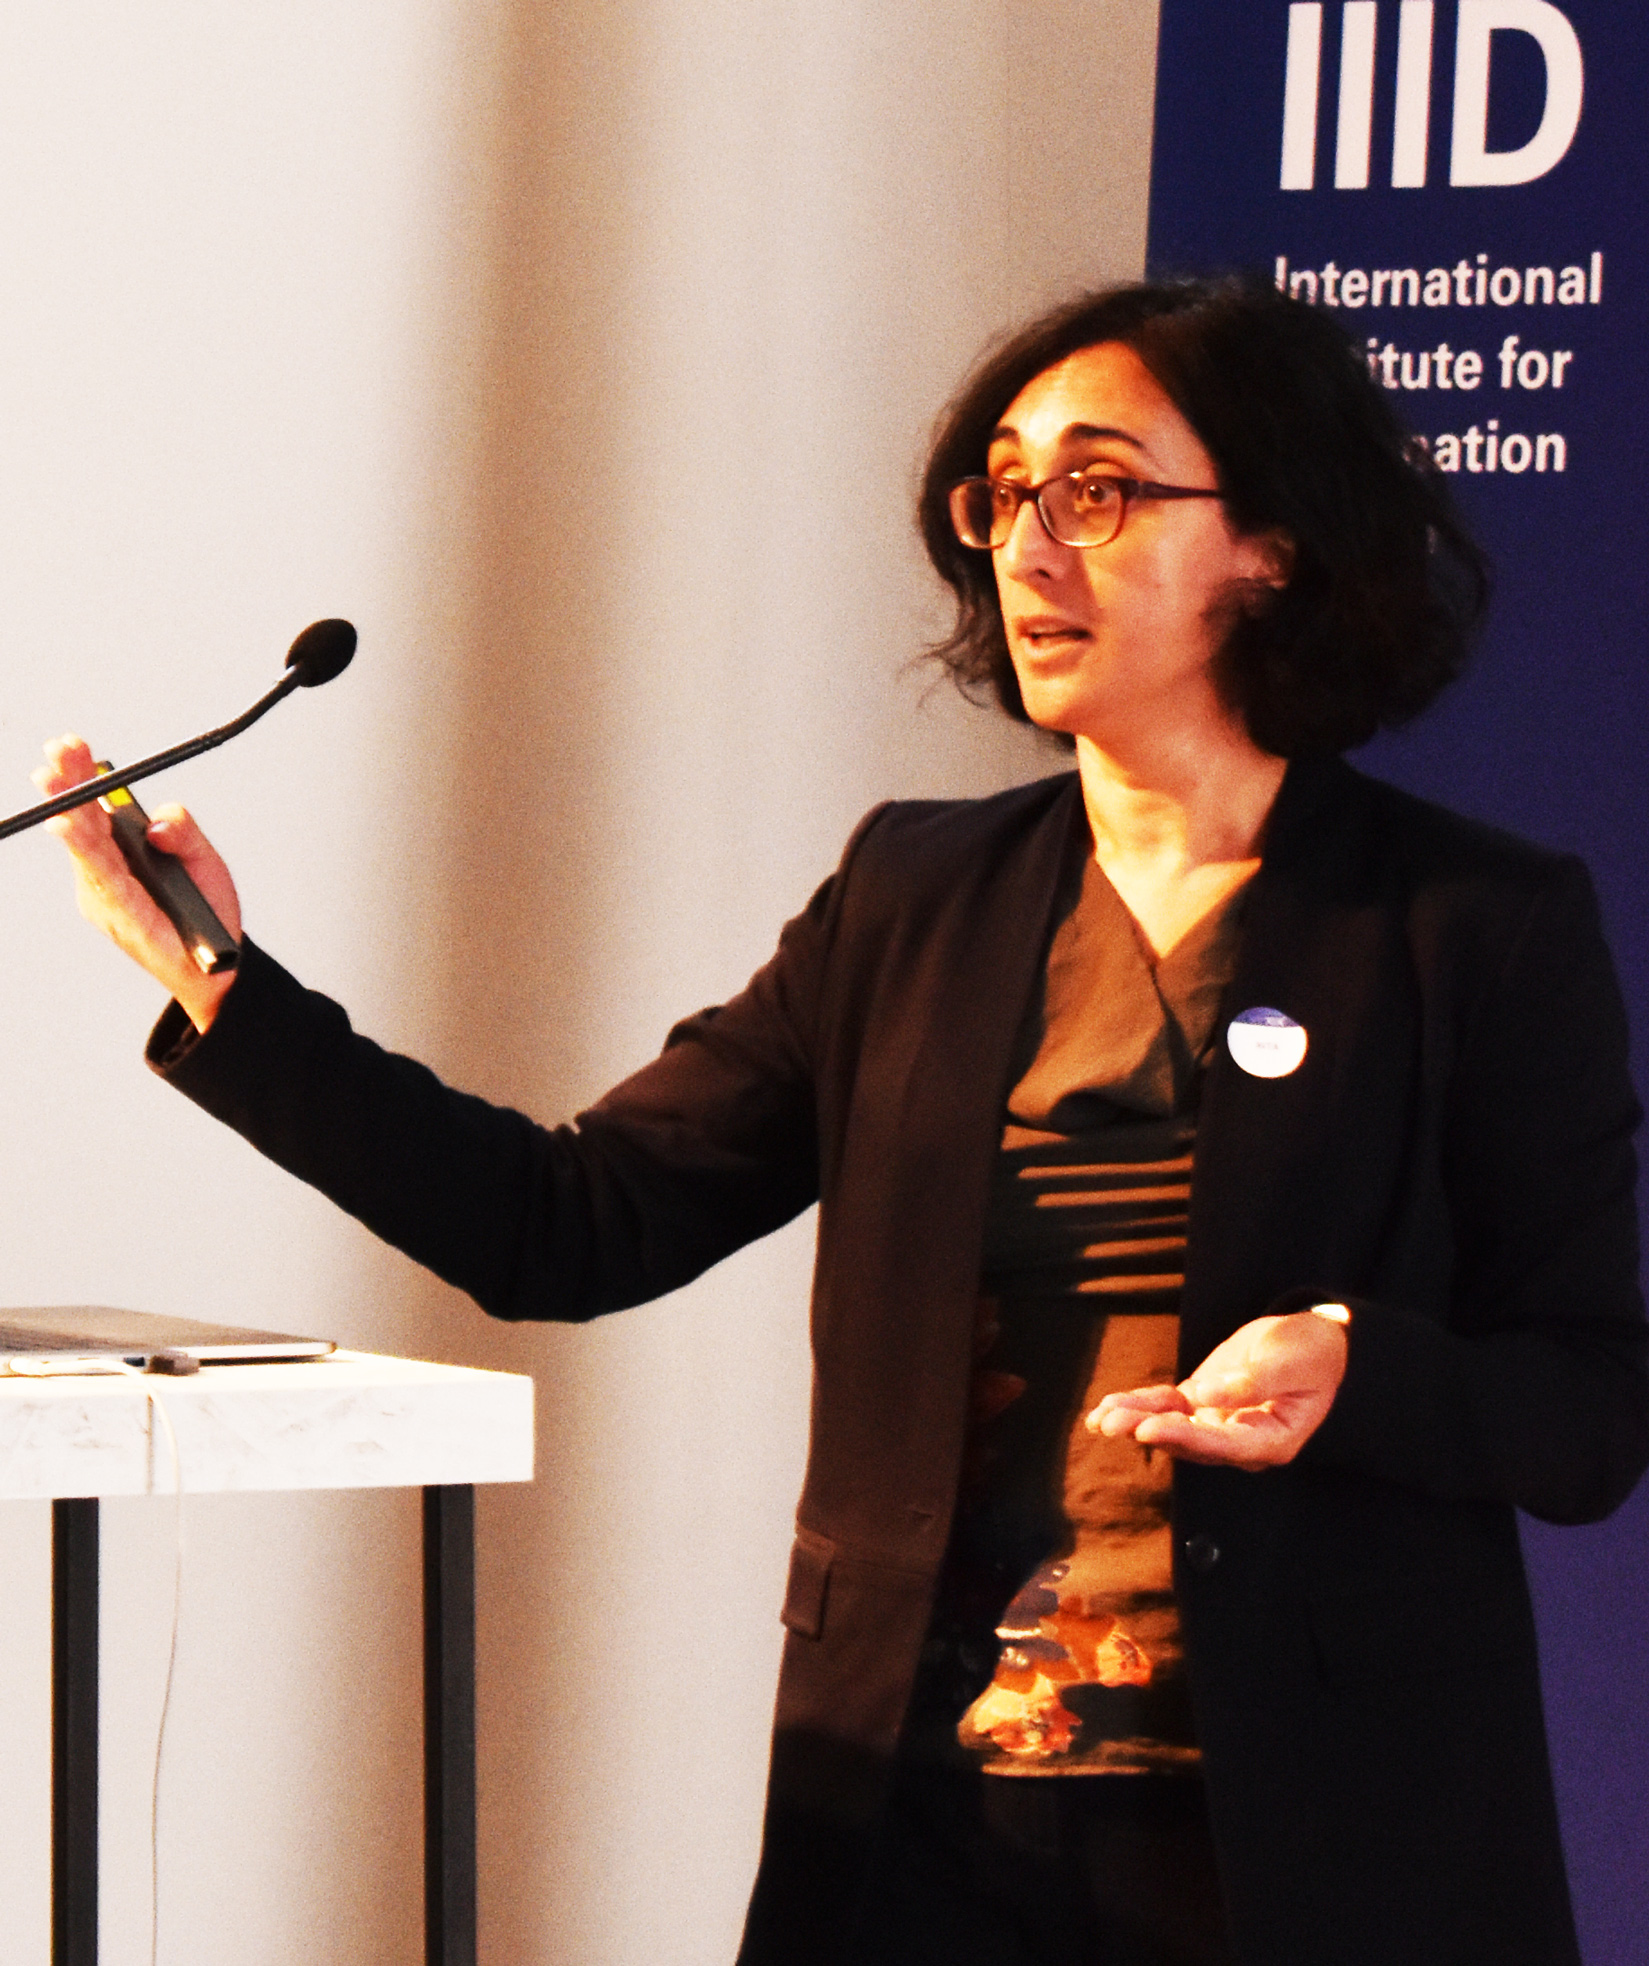
Rita Giordano, a UK-based data visualisation consultant and scientific illustrator, started the visual data and science studio. She worked for several years in research and in the data science industry. By training, she is a physicist who holds a PhD in statistics applied to structural biology. Furthermore, she has more than fourteen years of professional experience in data analysis and statistics. Over the years, she has developed her skills in illustration by attending specifically targeted short courses. Courses at the University of Arts of London and the “Ecole des beaux-arts” of Grenoble, France. She possesses a strong passion for data storytelling, showcasing scientific research and presenting comprehensible visualisations. The vision of the studio is to make data and science accessible to not experts. She is also a LinkedIn instructor. Check out her course called "Build Advanced Charts with R" on LinkedIn Learning.